Stacia Misner
August 2006
Applies to:
SQL Server 2005 Reporting Services
Execution logs
Summary: This article presents an excerpt from the book,
Microsoft SQL Server 2005 Reporting Services Step by Step
[ http://www.microsoft.com/mspress/books/9153.asp ] , by Stacia Misner
and Hitachi Consulting. Learn how to monitor reporting services by
implementing an execution logging database and reviewing reports that
query that database. (12 printed pages)
Contents
Introduction
Managing Execution Logging
Initializing an Execution Log Database
Using an Execution Log Report
Adding Current Data to the Execution Log
Conclusion
Related Books
Introduction
This article presents an excerpt from the book,
Microsoft SQL Server 2005 Reporting Services Step by Step
[ http://www.microsoft.com/mspress/books/9153.asp ] , by Stacia Misner
and Hitachi Consulting. Learn how to monitor reporting services by
implementing an execution logging database and reviewing reports that
query that database. Get the Reporting Services project demonstrated in
this article by downloading the
sample project [ http://datainspirations.com/uploads/rsexecutionlogging.zip ] and
related database
[ http://datainspirations.com/uploads/rs2005sbsdw.zip ] . Be sure to
attach the database to your SQL Server 2005 instance before you begin.
You
can monitor report execution performance using execution logs.
Execution logs differ from trace logs because the latter are stored in
a set of files, whereas execution logs are stored in the ReportServer
database. Because execution logs are intended for continual analysis,
the data is stored relationally. The information that is stored in the
ExecutionLog table of the ReportServer database isn't the best format
for general reporting and analysis, but you can create your own logging
database to which you can export logging records on a periodic basis.
Reporting Services supplies you with the following tools to facilitate
reporting on the logs:
- A script to create tables in your own database.
- A SQL Server 2005 Integration Services (SSIS) package to load logging records into this database.
- Reports that allow you to review the execution information loaded into the new database.
You
will work with these tools later in this article. You can schedule the
SSIS package to perform periodic extracts from the ExecutionLog table
to keep your logging database current and to allow you to delete rows
from the log tables.
Managing Execution Logging
You
can use the Site Settings page in Report Manager to start or stop
execution logging at any time. You must be assigned to the System
Administrator role in SQL Server to be able to change this setting. By
default, execution logging is enabled, and log records will be kept
only for 60 days. You can increase or decrease the number of days as
desired to limit the amount of logging history that accumulates in the
ExecutionLog table in the ReportServer database. Logging records that
exceed the specified number are removed each day at 2:00 AM (local time
for the Report Server). Alternatively, you can remove this limitation
if you want to allow logging records to accumulate indefinitely. If you
use the SSIS package mentioned earlier to copy the logs to a reporting
database, you can delete logs as soon as they are copied to the logging
database by adding an additional package step.
Review Current Execution Log Settings
In this procedure, you'll open the Site Settings page in Report Manager to review the current execution logging settings.
- Open Report Manager in Internet Explorer at http://localhost/Reports.
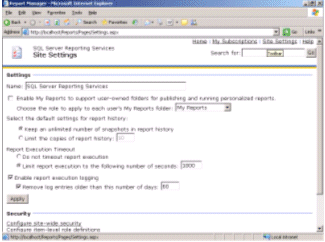
- Click the Site Settings link to review the settings shown here:
 [ http://msdn2.microsoft.com/en-us/library/aa964131.rsmnrptexpf01l(en-us,sql.90).gif ]
Figure 1 (Click on the image for a larger picture)
If you want to disable execution logging, you can clear the Enable Report Execution Logging
check box. Notice that you can type a different number of days to
change the frequency with which logging records are removed from the
ExecutionLog table. To make the changes take effect, click Apply.
Initializing an Execution Log Database
Reporting
Services provides the tools you need to effectively report and analyze
information related to report processing. To get started, you will need
to create a SQL Server database, and then you can use a supplied script
to build the necessary tables in your new database. After creating the
tables, you can use the SSIS package supplied by Reporting Services to
load the new tables with data from the ExecutionLog table.
Create and Load the Execution Log Database
In
this procedure, you'll create the RSExecutionLog database in which
you'll create tables using a script, and then use a SSIS package to
load data into the tables.
- Open Microsoft SQL Server Management Studio and connect to the Database Engine.
- Right-click the Databases folder, and then click New Database.
- Type a name for the database in the New Database Properties dialog box: RSExecutionLog.
- Click Options, set the Recovery Model to Simple, and then click OK.
- Click Open File
on the toolbar, navigate to the folder to which you extracted the
sample project, open the createtables.sql file, and connect to the
Database Engine.
Note The
createtables.sql file is included for your convenience in the practice
files. Reporting Services supplies this file in the SQL Server 2005
samples. After you install the samples, you'll find this file in the
C:\Program Files\Microsoft SQL Server\90\Samples\Reporting
Services\Report Samples\Server Management Sample Reports\Execution Log
Sample Reports folder.
- Click RSExecutionLog in the Available Database list box.
- Click the Execute button (or press F5) to run the createtables.sql script. The results of the query execution are displayed in the Messages tab on the Results pane:
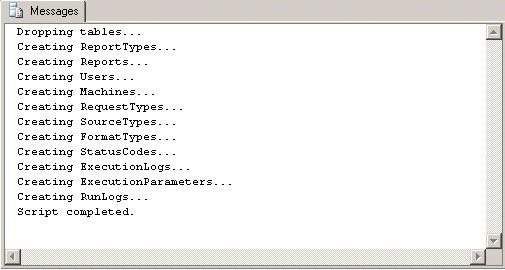
Figure 2
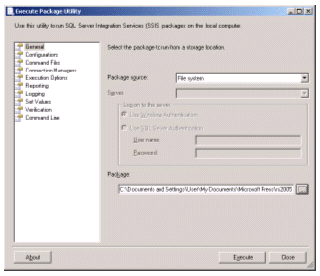
- In Windows Explorer, double-click RSExecutionLog_Update.dtsx file in the folder to which you extracted the sample project. The Execute Package Utility dialog box is displayed:
 [ http://msdn2.microsoft.com/en-us/library/aa964131.rsmnrptexpf03l(en-us,sql.90).gif ]
Figure 3 (Click on the image for a larger picture)
- Click Execute to start running the package.
Note As with the
script file you just used, the RSExecutionLog_Update.dtsx file is also
included for your convenience in the practice files. You can find this
file if you installed the SQL Server 2005 samples section in the
C:\Program Files\Microsoft SQL Server\90\Samples\Reporting
Services\Report Samples\Server Management Sample Reports\Execution Log
Sample Reports folder.
When package execution is complete, your screen looks like this:
 [ http://msdn2.microsoft.com/en-us/library/aa964131.rsmnrptexpf04l(en-us,sql.90).gif ]
Figure 4 (Click on the image for a larger picture)
- Click Close. Leave the Execute Package Utility open because you'll use it again in a later procedure.
Using an Execution Log Report
To
help you review the information extracted to the RSExecutionLog
database, Reporting Services supplies several sample execution logging
reports. The practice files supplied with this book include several
more reports to review execution log information. You can use the
reports with or without modification, or add your own reports to use
the execution logging information in different ways.
Deploy Execution Logging Reports
In
this procedure, you'll deploy the execution logging reports, review the
Average Report Execution Times report, and then deploy reports for
comparing execution times.
- Using Visual Studio, open the ExecutionLog
solution in the folder to which you extracted the sample project. The
Solution Explorer window looks like this:
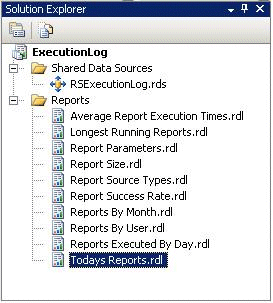
Figure 5
Note The
shared data source in this solution assumes that you have named the new
database RSExecutionLog, as described in the previous procedure, and
that the database is on the local server.
- Right-click the ExecutionLog project, and then click Deploy.
- When the project successfully deploys, open the Home page in Report Manager.
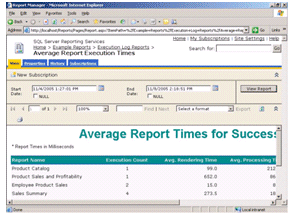
- Click the Example Reports folder link, click the Execution Log Reports folder link, and then click the Average Report Execution Times report link. The top of the report looks similar to this:
 [ http://msdn2.microsoft.com/en-us/library/aa964131.rsmnrptexpf06l(en-us,sql.90).gif ]
Figure 6 (Click on the image for a larger picture)
You'll
see report names and metrics in this report that correspond to your
usage of Reporting Services, but the speed of your computer might
result in times different than those shown in this report. You'll need
to scroll horizontally to see all averages calculated for a report.
Notice the report parameters to select a start and end date for the
report. The default values for these report parameters are calculated
from the earliest and latest dates in the RSExecutionLog database
tables.
In the sample report shown here, the Product Sales and
Profitability report has the longest rendering time. Your computer
might render faster or slower. As you review the details of this
report, you can see that the reports are listed in descending order of
average total execution time. This execution time includes data
retrieval, processing, and rendering time, which are displayed in
separate columns for comparison.
- Using Visual Studio, open the Filter vs Parameter solution in the folder to which you extracted the sample project.
- On the Build menu, click Deploy Filter vs Parameter.
The two reports in this solution use identical queries. You will
execute these reports to compare the difference between the time to
execute a report that uses a dataset filter, Product Profitability
Filter, and the time to execute a report that uses a query parameter,
Product Profitability Query Parameter.
- When the project successfully deploys, switch from Visual Studio to Report Manager, and then click the Execution Log Reports link.
- Click the Product Profitability Filter report link to execute the report.
The execution time required for this report includes data retrieval,
report processing, and rendering time, because this is the first time
the report has been executed since deployment to the Report Server.
- In the Category drop-down list, select Accessory, and then click View Report.
Since this report uses a dataset filter, there is no execution time
for data retrieval or report processing when you change the category
value. Only rendering time will be required to display Accessory data
in this report.
- In the Category drop-down list, select Bike, click View Report, and then repeat this step for the Clothing category.
- Click the Execution Log Reports folder link.
- Click the Product Profitability Query Parameter Report link to execute the report.
- In the Category drop-down list, select Accessory, and then click View Report; repeat this step for the Bike category, and then again for the Clothing category.
This report is created with query parameters, so each time you click View Report, execution time includes data retrieval, report processing, and rendering time.
- Click the Execution Log Reports folder link.
- Click the Average Report Execution Times report link.
Notice that neither the Product Profitability Filter report nor the
Product Profitability Query Parameter report is displayed in this
report. The execution log reports are dependent on the data that
currently exists in the RSExecutionLog database, which was extracted before
you executed the product reports. You need to update the RSExecutionLog
database to append records for the execution logging for the product
reports.
Adding Current Data to the Execution Log
The
RSExecutionLog is not designed to stay synchronized with the execution
logging data in the ReportServer database. You need to determine a
reasonable frequency for updating the RSExecutionLog database with new
execution logging records, and then schedule the SSIS package to
execute with this frequency. (Refer to SQL Server Books Online for more
information about scheduling an SSIS package.)
Update the Execution Log Database
In this procedure, you'll update the RSExecutionLog database by executing the RSExecutionLog_Update package.
- Switch to the Execute Package Utility, and then click Execute.
- Click Close twice. The SSIS package appended new records to the RSExecutionLog database.
Note Rather than
append records to the logging database, you might want to remove
records for older data. You can use the cleanup.sql script in the
folder to which you extracted the sample project. This file is also
located in the C:\Program Files\Microsoft SQL
Server\90\Samples\Reporting Services\Report Samples\Server Management
Sample Reports\Execution Log Sample Reports if you installed the SQL
Server 2005 samples.
- Close the Execute Package Utility.
Compare Execution Performance
In
this procedure, you'll use execution logging reports to compare the
performance of the Product Profitability Filter and Product
Profitability Query Parameter reports.
- In Report Manager, return to the Execution Log Reports page, and then click the Average Report Execution Times report link.
- If
necessary, replace the values in the Start Date and End Date boxes with
the current date and time in the End Date box, and then click View Report.
You might need to scroll through the report to find the product
reports. The averages for the product reports should look similar to
this:
 [ http://msdn2.microsoft.com/en-us/library/aa964131.rsmnrptexpf07l(en-us,sql.90).gif ]
Figure 7 (Click on the image for a larger picture)
Note The
report shown in this example was exported to Microsoft Excel and
reformatted to better display all data for these two reports. You might
need to scroll horizontally to view the values in each column in Report
Manager.
The averages shown in your report will differ
because of variations in server configurations. Using the report
illustrated here, you can see that the relative performance of the two
reports is similar. The average rendering time of the two product
reports in the previous illustration is nearly the same, because
rendering was required when each report was opened and each time View
Report was clicked. The processing time and data retrieval time is
greater for the Product Profitability Filter report, even though the
query executed only once. However, the query retrieved data for all
categories, which increased the data retrieval time as well as the
processing time of the report. In the case of the Product Profitability
Query Parameter report, the use of query parameters to retrieve a
smaller dataset actually resulted in faster performance overall
compared to the other report.
As indicated in the Average Report Execution Times report, the
times displayed in the report are milliseconds, so any delay
experienced by the user in executing these reports is not particularly
noticeable. However, when you are working with reports including
production data, you can use the information in the Average Report
Execution Times report to help you discover bottlenecks so you can take
appropriate action to resolve report problems. For example, if you see
that data retrieval is consuming a considerable amount of the overall
processing time, you might try to improve the performance of the SQL
query. If, on the other hand, you see processing is taking a long time,
you might look for ways to reduce the complexity of the report.
- Click the Execution Log Reports folder link, and then click the Report Parameters report link.
- Expand Product Profitability Filter, and then expand Product Profitability Query Parameter. The top of the report looks similar to this:
 [ http://msdn2.microsoft.com/en-us/library/aa964131.rsmnrptexpf08l(en-us,sql.90).gif ]
Figure 8 (Click on the image for a larger picture)
This
report lets you compare and contrast the average total execution time
by report parameter. This average is computed by dividing the total
execution time for the report by the number of report executions.
- Click the Execution Log Reports folder link, and then click the Report Source Types report link.
- Expand Product Profitability Filter, and then expand Product Profitability Query Parameter. The top of the report looks similar to this:
 [ http://msdn2.microsoft.com/en-us/library/aa964131.rsmnrptexpf09l(en-us,sql.90).gif ]
Figure 9 (Click on the image for a larger picture)
Here,
you can see execution times by source type. Possible source types are
Snapshot, Live, Cache, and History. Because the source type can affect
execution times, you should review this report when evaluating the
performance of a report.
Conclusion
With
an execution log, you can monitor the duration and success rate of
report executions, identify bottlenecks by examining execution times,
and optimize report executions by using request frequency, execution
times, and user information to help you choose an appropriate execution
method for each report. In this article, we showed you how to create an
execution logging database, how to execute an Integration Services
package to load execution logging data into the database, and how to
use reports to review execution log information.
Related Books
Microsoft SQL Server 2005 Reporting Services Step by Step [ http://www.microsoft.com/mspress/books/9153.asp ]